Silicon Photomultipliers & Avalanche Photodiodes
A silicon photomultiplier (SiPM) is solid state detector comprised of an array of reverse biased photodiodes. The bias voltage is large so that the photoelectron/hole pair created by photon absorption is accelerated by the resultant electic field and acquires enough energy to liberate secondary charge carriers. This process repeates, causing an avalanche, hence the name avalanche photodiode (APD). The resultant charge multiplication or gain is large (\(10^5 - 10^7 \)) and the avalanche is fast (ns) so that individual photons generate current pulses of sufficient amplitude to be detectable.
This summary suggests that a SiPM can be used to count photons and is therefore an ideal linear photodetector. The linear regime cannot extend without limit because an APD is "blind" for some period after detecting a photon and above some intensity it will fail to detect a fraction of subsequent events. As we will see, by assembling an array of APDs, the SiPM design affords greater dynamic range than a single APD but there remain limits to the linearity of the device.
APDs & Microcells
One of the unique features of a SiPM is that it is assembled from hundreds to thousands of individual APDs.

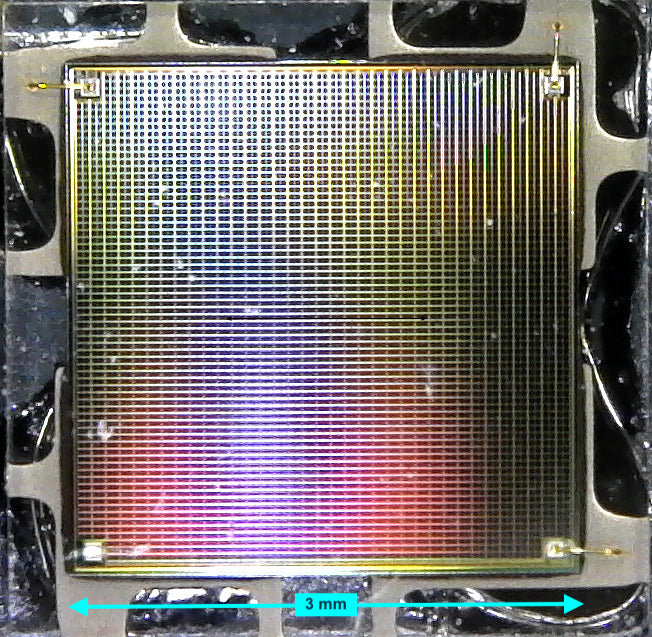
The image shows the structure of an onsemi MICRO-FC-30035 SiPM with 4774 APDs or microcells. The device is 3mm \( \times \) 3 mm and each microcell is 35 \(\mu\)m \( \times \) 35 \(\mu\)m and appears as a tiny black square. Unlike a CCD or a CMOS sensor the photodiodes which comprise the SiPM are not separately readout or addressed\(-\)they are all connected in parallel and the output signal cannot be traced back to an individual diode.
Avalanche & Quenching
To understand SiPM non-linearity we must first understand how the avalanche triggered by the absorption of a photon terminates. Consider the equivalent circuit for an APD adopted by Hamamatsu.

In this model, an APD is idealized as a perfect switch (APD) with diode junction capacitance, CJ. Each APD in the SiPM array has its own quench resistor, RQ. The resistor, RS, represents the resistance of the APD during discharge, which is initiated by the TRIGGER signal. The breakdown voltage of the APD is represented by voltage source, VBR, and the externally applied bias voltage is VBIAS.
In the absence of light (and neglecting thermal excitations which cause dark current) the photodiode junction capacitance charges up to VBIAS through RQ. When a photon generates an electron/hole pair the switch turns on. Two things now happen: 1) a current pulse (red) begins to flow in the circuit and; 2) the voltage across the APD (blue) starts to fall. The current pulse, with a sub-ns rise time set by the \( R_S C_J\) time constant, signifies the detection of a photon. Once current starts to flow, the diode junction capacitance discharges faster than it can be replenished through RQ and the voltage drops to the breakdown voltage (horizontal blue dotted line), terminating or quenching the avalanche.

The diode switches off and the voltage recovers as CJ recharges through RQ with a time constant \( R_Q C_J \). This interval represents a deadtime in which an individual APD is unresponsive. Here, the rise and fall times are representative of the onsemi MICRO-FC-30035 in the Eikonal SIPM-01 module (0.6 ns and 82 ns respectively). This disparity in these times reflects the fact that the quench resistor is much larger than the resistance through which the diode discharges.
Light Pulses & Non-Linearity
If two microcells are triggered simultaneously the output is a linear superposition of two current pulses. Thus, the brighter the incident intensity, the stronger the response. However, if the same microcell absorbs two photons on a timescale comparable to the recharge time \( R_Q C_J \), only a single current pulse ensues. For high intensity nanosecond duration pulses we can expect to experience non-linear response.
The following image helps visualize the circumstances when a brief pulse is incident on a SiPM. The image depicts an array of 69 \( \times \) 69 = 4761 microcells. Each microcell has 100% detection efficiency and when a microcell receives one or more photon it is displayed as white.  The upper right image shows the array when the pulse contains 10 photons. In this example 10 microcells were triggered. In the next panel 100 photons triggered 97 microcells because 3 photons landed in microcells that had already recorded a detection. In the third panel with 1000 photons only 909 events were recorded and in the last panel with 10,000 photons only 4160 microcells produced events. As the number of photons in a pulse increases, the chances that an incident photon lands on a microcell that has already triggered increases. Therefore, the responsivity of the SiPM decreases with light pulse intensity and the response is non-linear.
Light Pulses & Bernoulli Trials
The procedure illustrated in the simulated images showing triggering of microcells by a group of photons is a statistical experiment known as a Bernoulli trial. We are given \( n \) trials (the number of photons) for which the probability of success is \( p\) (the probability a photon triggers one of \( M \) microcells), and we want to know the probability of achieving \( k \) successes. If the detection efficiency for a single photon is 100% the probability that one photon lands in a given microcell is \( p = 1/M \). If we want to include the quantum efficiency, \( \eta < 1 \), then \( p = \eta /M \).
Rather than calculating the probabilty of a microcell receiving one or two or three or more photons, it is easier to calculate the probability that a microcell receives none. The probability of a given microcell failing to receive a photon is just \( 1- \eta/M\), so in \( n \) trials the probability of a a microcell not being triggered is \[ P(k=0) = \left(1 - \eta/M \right)^{n} . \] Probabilities must sum to unity, therefore \( P(k=0) + P(k\ge 1) = 1\) and \[ \begin{eqnarray} P(k\ge 1 ) &=& 1- \left(1 - \eta/M \right)^{n} \\ & \simeq & 1- \exp \left( - \eta \frac{ n}{M}\right) ,\end{eqnarray}\] using the Bernoulli approximation for \( e \). The exponential approximation is sufficient for all practical purposes unless there are only a handful of microcells and \(M \sim 1\) .
The Linear Regime
On average, when \( n \) photons are incident on \(M \) microcells, the number of microcells with one or more photons is the product \( M P(k\ge 1) \). As we are assuming that the light pulse is shorter than the microcell recharge time and a single microcell can only produce a single current pulse, the number of photon events recorded by the SiPM is \[ N = M \left[ 1- \exp \left( - \eta \frac{n}{M}\right) \right] .\] For small numbers of photons (\(\eta n \ll M\)), \[ N = \eta n ,\] the SiPM responds linearly to the number of incident photons. When \(\eta n \ll M\) the number of recorded events per detected photon, \( \partial N / \partial (\eta n ) \) , is unity. If we define the non-linearity as \(\rm{N.L.} = 1 - \partial N / \partial (\eta n ) \) then \[ \rm{N.L.} = 1- \exp\left(- \eta n/M \right). \] As the number of photons in the pulse approaches the number of microcells, the SiPM becomes increasingly non-linear as shown in the plot below.  As a rule of thumb, better than 10% non-linearity is achieved when there are more than 10 microcells per detected photon in the light pulse being measured.
Measuring the Number of Photons in a Nanosecond Pulse with a SiPM
We measured the linearity of the Eikonal plug-and-play SiPM detector module (SIPM-01) in response to nanosecond laser pulses. The Eikonal SiPM detector module is equipped with an onsemi MICRO-FC-30035 detector, which has 4774 microcells and a recovery time of 82 ns. The Eikonal nanosecond pulsed laser diode (NLD-01) is ideal for this exploration because it delivers up to 0.4 nJ or \(1.3 \times 10^6\) photons in a few nanoseconds. We used a set of neutral density filters with optical densities up to OD 4.5 to explore the transition from linear to non-linear response.  Measurements of the SiPM signal were collected at 2 GS/s using a Tektronics TDS380 scope and integrated numerically to record the strength of the laser pulse. The plot shows the measured SiPM response together with the theoretical expectation (red curve) derived above.
Below \( 10^3 \) photons per pulse the results show good agreement with linear response. At \( 5\times 10^3 \) photons per pulse (\( n \simeq M \)) both the model and data begin to reveal a marked deviation from linear behavior. At the last data point (\( 2\times 10^4 \) photons per pulse), the measured signal is well into the non-linear regime. The gain of the RF amplifier in the SIPM-01 module is chosen such that saturation of the amplifier and significant SiPM non-linearity occur at approximately the same photon flux.
Conclusions
The microcell architecture of SiPMs means that they can be used to measure nanosecond light pulse intensity over many orders of magnitude. However, it is important to be aware that non-linear effects must be taken into account when the number of incident photons on the SiPM within the microcell recharge time approaches the number of microcells. SiPMs are available with a large range of number of microcells; please contact us to customize your integrated SiPM detector module to fit your needs.
© Eikonal Optics